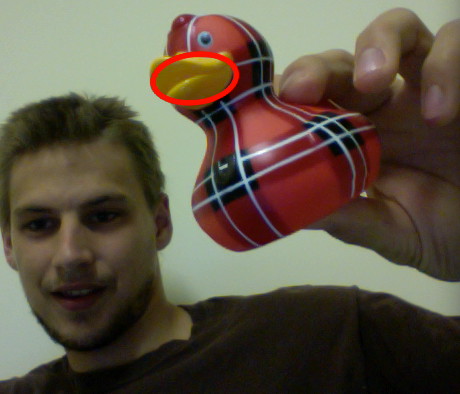
I have recently been playing with OpenCV in Python for webcam image analysis. This real time analysis of camera footage can be of real benefit to some of the microscopy techniques that I work on. Here however is a more lighthearted project which I created for a talk I am giving in a local school. The program tracks a yellow object and uses it to control the mouse position (see vid below). I thought it would be fun to replace the overused laser pen with a rubber duck for the presentation and show the kids how easy it can be to achieve what at first looks like complex tasks with some basic programming. Full code given at the bottom of the page.
First a brief bit of background. OpenCV is a cross platform, open source computer-vision library created by Intel. This means it is free to access by anyone and will work on any operating system. I am using a Python implementation of OpenCV in this example. Python is a fantastic language to start out with. The syntax is very simple and it works as both a basic scripting language and a higher level object orientated programming language. In short it is easy to pick up by those with little programming experience but is capable, when in the right hands, of producing complex programs using techniques that are now commonplace in the more, shall we call it, 'professional' languages such as C. Python is again open source and cross platform so is free to use by anyone on any computing system.
I have been really impressed at how accessible OpenCV is. It has a lot of very powerful functions built in and with Python does not require extensive programming knowledge to access this potential. It really is straightforward to capture and display webcam images and perform object tracking or face recognition type tasks. It also seems to be massively under-reported on the web, hence why I thought I would add this example which is a slight twist on some of the others out there.
The code is given in full below, it is fairly extensively commented and also provides some additional functionality so dont be too taken aback by the length of it. There are some bonus features built in that are not necessary for simple tracking. I will give a brief overview here but is should be reasonably obvious what is happening by following the code (Hint: start at def main() at the bottom)
The steps are:
- Capture image
- Convert Image to HSV (Hue, Saturation, Value)
- Threshold the image based on the hue value. Hue is independent of the intensity and saturation therefore it will select all pixels within a specific colour range i.e. yellow and the lighting conditions will not be massively critical. The output is binary so a map is produced of white pixels (representing yellow) and black pixels for every other colour.
- Basic noise filtering - An algorithm removes speckles and other random noise from the thresholded image.
- Contours are fitted which enclose areas of white pixels.
- The largest contour is found and its centre position is used to set the mouse position
References:
- A really good book on OpenCV is free to download here, bear in mind it is written for C but it gives a great overview of all the functions available and what they do.
- The Python OpenCV manual can be found here. This defines how to call the specific functions in Python and what variables they require.
- Inspiration for this project was initially taken from this blog which shows how to track a coloured ball in C.
- Python 2.7.2
- OpenCV 2
- Mac OSX Lion
A note on additional package requirements:
pylab is part of the MatPlotLib package (based on SciPy/NumPy) - I use this here for some basic mathematical tools. It is my standard Maths and Plotting library and I highly rate it however with a slight tweak of the code NumPy should be sufficient.
The object tracking should not be dependant on platform however the mouse positioning code is exclusive to Mac OSX.
pyObjC is required for the setting the mouse position in Mac OSX.
Code: (I apologise for the low quality formatting on Blogger - full code is also available to Download: LaserDuck.py)
# Track objects in webcam based on Hue value.
# Use object position to control cursor on macbook
# Optimised to track yellow beak of rubber duck!
# ctrl+c  Quits program


import cv
import sys
from pylab import *
from objc import loadBundle, loadBundleFunctions  #required for mouse position.


# Set mouse position in OSX
class ETMouse():
    def setMousePosition(self, x, y):
        bndl = loadBundle('CoreGraphics', globals(),
                '/System/Library/Frameworks/ApplicationServices.framework')
        loadBundleFunctions(bndl, globals(),
                [('CGWarpMouseCursorPosition', 'v{CGPoint=dd}')])
        CGWarpMouseCursorPosition((x, y))


#    Convert image to HSV and threshold to produced binary image based on Hue value.
def thresholdImage(img):
    #allocate temp image based on size of input img
    img_hsv = cv.CreateImage((img.width,img.height),8,3)   #3 channel
    img_thresh = cv.CreateImage((img.width,img.height),8,1)#1 channel

    cv.CvtColor(img, img_hsv, cv.CV_BGR2HSV)
    cv.InRangeS(img_hsv, cv.Scalar(5, 100, 100), cv.Scalar(30, 255, 255), img_thresh);

    return(img_thresh)

#    Plot a histogram showing Hue vs Saturation.  Not necessary for function of program, useful for optimising image thresholds
#    Samples from box in top corner of camera image only.
def histogram(src):
    # Set ccd sampling region.
    cv.SetImageROI(src,(10,10,100,100))

    # Convert to HSV
    hsv = cv.CreateImage(cv.GetSize(src), 8, 3)

    cv.CvtColor(src, hsv, cv.CV_BGR2HSV)
    s_plane = cv.CreateMat(cv.GetSize(src)[1], cv.GetSize(src)[0], cv.CV_8UC1)
    h_plane = cv.CreateMat(cv.GetSize(src)[1], cv.GetSize(src)[0], cv.CV_8UC1)

    cv.Split(hsv, h_plane, s_plane, None, None)
    planes = [h_plane, s_plane]

    h_bins = 28
    s_bins = 5
    hist_size = [h_bins, s_bins]
    # hue varies from 0 (~0 deg red) to 180 (~360 deg red again */
    h_ranges = [0, 180]
    # saturation varies from 0 (black-gray-white) to
    # 255 (pure spectrum color)
    s_ranges = [0, 255]
    ranges = [h_ranges, s_ranges]
    scale = 15


    # calculate histogram
    hist = cv.CreateHist([h_bins, s_bins], cv.CV_HIST_ARRAY, ranges, 1)
    cv.CalcHist([cv.GetImage(i) for i in planes], hist)
    (_, max_value, _, _) = cv.GetMinMaxHistValue(hist)

    # Reset cv sampling region to full CCD Area
    cv.ResetImageROI(src)


    # plot histogram data
    hist_img = cv.CreateImage((h_bins*scale, s_bins*scale), 8, 3)

    for h in range(h_bins):
        for s in range(s_bins):
            bin_val = cv.QueryHistValue_2D(hist, h, s)
            intensity = cv.Round(bin_val * 255 / max_value)
            cv.Rectangle(hist_img,(h*scale, s*scale),((h+1)*scale - 1, (s+1)*scale - 1),cv.RGB(intensity, intensity, intensity),cv.CV_FILLED)
    return hist_img


#    Filter noisy pixels using custom kernel size.
#    Removes visually insignificant noise such as speckles
def erodeImage(img):
    kernel = cv.CreateStructuringElementEx(9,9,5,5, cv.CV_SHAPE_CROSS)
    # Erode- replaces pixel value with lowest value pixel in kernel
    cv.Erode(img,img,kernel,2)
    # Dilate- replaces pixel value with highest value pixel in kernel
    cv.Dilate(img,img,kernel,2)
    return img

def contour_iterator(contour):
                while contour:
                        yield contour
                        contour = contour.h_next()


def findImageContour(img,frame):
    storage = cv.CreateMemStorage()
    cont = cv.FindContours(img, storage,cv.CV_RETR_EXTERNAL,cv.CV_CHAIN_APPROX_NONE,(0, 0))
    max_center = [None,0]
    for c in contour_iterator(cont):
    # Number of points must be more than or equal to 6 for cv.FitEllipse2
    # Use to set minimum size of object to be tracked.
        if len(c) >= 60:
            # Copy the contour into an array of (x,y)s
            PointArray2D32f = cv.CreateMat(1, len(c), cv.CV_32FC2)
            for (i, (x, y)) in enumerate(c):
                PointArray2D32f[0, i] = (x, y)
                # Fits ellipse to current contour.
                (center, size, angle) = cv.FitEllipse2(PointArray2D32f)
                # Only consider location of biggest contour  -- adapt for multiple object tracking
            if size > max_center[1]:
                max_center[0] = center
                max_center[1] = size
                angle = angle

            if True:
                # Draw the current contour in gray
                gray = cv.CV_RGB(255, 255, 255)
                cv.DrawContours(img, c, gray, gray,0,1,8,(0,0))

    if max_center[1] > 0:
        # Convert ellipse data from float to integer representation.
        center = (cv.Round(max_center[0][0]), cv.Round(max_center[0][1]))
        size = (cv.Round(max_center[1][0] * 0.5), cv.Round(max_center[1][1] * 0.5))
        color = cv.CV_RGB(255,0,0)

        cv.Ellipse(frame, center, size,angle, 0, 360,color, 3, cv.CV_AA, 0)
        ETMouse().setMousePosition(2.6*max_center[0][0]-150, 2*max_center[0][1]-100)


def main():
    # create windows for use later
    cv.NamedWindow("LaserDuckOut",1)
    cv.NamedWindow("Theshold_IMG",1)
    cv.NamedWindow("HSV Histogram",1)
    # initiate camera
    capture = cv.CreateCameraCapture(0)

    # grab frame from camera
    if capture:
        while True:
            frame = cv.QueryFrame(capture)
            if not frame:
                cv.WaitKey(0)
                break

            cv.Flip(frame, frame,1)

            hist = histogram(frame)

            img = thresholdImage(frame)
            img = erodeImage(img)

            findImageContour(img,frame)


            # Mark out sampling region for histogram
            cv.Rectangle(frame,(10,10),(110,110),(0,255,0),1,0)


            # outputs image to windows created previously
            cv.ShowImage("Threshold_IMG",img)
            cv.ShowImage("LaserDuckOut",frame)
            cv.ShowImage("HSV_Histogram",hist)

            if cv.WaitKey(10) >= 0:
                break

    cv.DestroyWindow("LaserDuckOut")
    cv.DestroyWindow("Threshold_IMG")
    cv.DestroyWindow("HSV_Histogram")


if __name__=='__main__':
    main()
1 comment:
Hi. This looks cool. Thanks for posting. -Ben
Post a Comment